Introduction
For over two years after the COVID-19 pandemic first devastated the world in the early months of 2020, North Korea (also known as the Democratic People’s Republic of Korea [DPRK]) reported to the international community that it had no domestic cases of COVID-19, until the country’s first outbreak was announced in May 2022 (Lee & Kim, 2022). It was only three months after this that the DPRK declared that it had eradicated the disease within its borders – a claim that the international community perceived as dubious due to credibility issues with the DPRK’s reported data (Wright, 2022).
The COVID-19 pandemic caused a major negative economic shock worldwide, contracting the global economy in 2020 by 3.2% and reducing global trade by 5.3% (Jackson et al., 2021). Despite responsive fiscal and monetary policies by governments around the world and increases in the availability of vaccines in developed countries (and developing countries, albeit more slowly), global economic growth and output were not forecasted to return to normal levels until 2024 due to the prolonged and evolving nature of the COVID-19 virus (Jackson et al., 2021). As well as this, fallout from the pandemic has disproportionally affected low-income and emerging economies: Sub-Saharan Africa experienced its worst economic contraction on record, Latin America and the Caribbean experienced an average economic contraction of 7.7%, and foreign direct investment flows to developing countries fell by 42% in 2020 alone (Al-kasasbeh et al., 2022; CEPAL, 2021; IMF, 2021).
North Korea is one of the poorest and most economically closed-off countries in the world; since the country’s economic and political affairs are rigidly structured around the current supreme leader Kim Jong-un’s regime, North Korea is extremely vulnerable to economic shocks that could destabilize the regime and country as a whole (Albert, 2020). In particular, North Korean society is divided into three songbun classes based on loyalty to the Kim regime. Those in higher songbun classes have relatively more political and economic power, and are overwhelmingly located in the capital of Pyongyang, while citizens of lower classes are located (sometimes forcibly) farther from the capital (Albert, 2020). Human rights violations are rife for citizens of North Korea, especially those of lower songbun classes, and include restrictions on freedom of speech, movement, and right to life; torture and inhumane treatment; subjection to political prison camps and arbitrary detention; enforced disappearances; restrictions on access to outside information; and other egregious abuses. These violations have historically been exacerbated during periods of hardship in the DPRK, such as during the Arduous March in the mid and late 1990s, when food shortages from natural disasters combined with a lack of safeguards and failed economic and agricultural policies led to the death of 3%–5% of North Korea’s population from hunger and disease (Haggard et al., 2007). This disproportionately affected those in lower songbun classes, who were last to receive food rations and receive medical treatment from the DPRK’s public distribution system (Haggard et al., 2007).
The next catalyst for famine and increased human rights abuses in North Korea may have already arrived with the COVID-19 pandemic. Preliminary estimates made by South Korea’s central bank indicated that North Korea’s economy shrank in each of the first three years following the pandemic (Lee, 2023). However, due to the closed nature of the DPRK, traditional economic measures of country performance – such as gross domestic product (GDP) and trade volumes – are almost impossible to obtain, reducing the reliability of current economic activity estimates (Lee, 2023). The detrimental influence that a negative economic shock could have on human rights, food security, and livelihoods for North Korean citizens fuels the need to corroborate estimates on economic activity in the DPRK after the onset of the COVID-19 pandemic, as well as discover spatiotemporal patterns in economic activity during the pandemic that highlight how the DPRK (and potentially other closed regimes) decide to reallocate precious economic resources during negative economic shocks.
This article will use nightlight data to geospatially analyze economic activity in North Korea, with the goal of determining changes in economic activity vis-à-vis nightlight intensity data as a result of the COVID-19 pandemic. These nightlight intensity changes will be measured by its distance from North Korea’s capital, Pyongyang, to investigate the possibility of varying effects on economic activity by distance from the capital during the pandemic. Along with this, the 186 districts in the DPRK, clustered into nine provinces, including Chagang, Kangwon, North Hamgyong, North Hwanghae, North Pyongan, Ryanggang, South Hamgyong, and South Hwanghae, as well as the separately administered capital of Pyongyang, Kaesong industrial region, Sinuiju special administration zone, and Rason special economic zone (SEZ; 13 regions total) will be investigated to determine if there were particular patterns in the reallocation of economic activity during the COVID-19 pandemic. Nightlight data was used versus other non-traditional measures of economic activity because it is free to obtain, publicly available, and can provide an unbiased proxy for economic activity, which is useful for the closed and private economy of the DPRK.
This article first hypothesizes that there will be a general decrease in nightlight intensity from before the onset of the COVID-19 pandemic (January 2020) to a two-year period after the pandemic’s onset (January 2022), due to the disproportionately negative economic effects that COVID-19 was assumed to have on North Korea’s economy (along with possible restrictions, such as curfews and building closures, placed by the North Korean regime to reduce the spread of COVID-19). Second, this article hypothesizes that – as the distance from the capital Pyongyang increases – the reduction in average nightlight intensity in districts will increase, as the DPRK would likely try to preserve economic activity for those in higher songbun classes, who are often located in the capital, along with areas that have a higher population density/urban population (which may be closer to Pyongyang). Third, this article hypothesizes that districts bordering China and South Korea would experience increases in nightlight intensity compared to other regions, as harsh border lockdowns and other COVID-19 restrictions imposed by the DPRK could lead to more border patrols and human activity in border areas. Fourth, this article hypothesizes that comparatively, provinces in North Korea focused on manufacturing, chemical and nuclear weapons development, and missile launch sites – particularly Chagang (with its nuclear and other weapon development centers), Kangwon (with its manufacturing hub in Wonsan), North Hamgyong (with its steel and fiber industries, and rocket launching sites), North Pyongan (with its light industry and textile centers), Ryanggang (with its product distribution and textile centers), and the special economic/administrative zones of Kaesong, Sinuiju, and Rason – will have more outsized negative changes in economic activity after the onset of the COVID-19 pandemic. Conversely, provinces focused on primary goods procurement in agriculture, mining, forestry, and other related sectors – North Hwanghae (with its large fertilizer industry), South Hamgyong (with its fertile cropland and diverse economic sector), South Hwanghae (with its abundant farming), and Pyongyang – will be insulated from these pandemic-induced negative changes in economic activity, due to the regime prioritizing the procurement of necessities (such as coal and wood for heating/lighting, agriculture, and food procurement/processing) versus tasks considered less urgent for the health and survival of the population during the population (such as manufacturing and nuclear/chemical weapons development).
The use of nightlight intensity as a proxy for economic activity in a country is well-established, since the first study establishing the relationship between satellite observed visible-near infrared emissions (i.e., observed lights) and economic activity was published nearly three decades ago (Elvidge et al., 1997). Other studies have corroborated and expanded upon the research of Elvidge et al., including research showing that nightlight data from satellites can augment conventionally measured economic growth at both the sub and supra-national level (Henderson et al., 2012). Further studies have established that Visible Infrared Imaging Radiometer Suite (VIIRS) data provides a reliable proxy for municipal regional domestic product and other measures of economic change in middle and low-income countries, with the caveat that positive correlation in the results is higher for urban regions than rural regions (although positive correlation still exists in rural regions) (Pérez-Sindín et al., 2021).
Research has started to surface that incorporates nightlight data to determine the economic impacts of the COVID-19 pandemic in countries that have difficulties in obtaining traditional economic measures. One such study uses nightlight data to predict the economic impact of COVID-19 in India, corroborating previous research showing that nightlights can reliably predict short-term impacts of economic shocks such as COVID-19 (Dasgupta, 2022). Other studies looked at the COVID-19 lockdown induced differences in human activity vis-à-vis nightlight intensity data in mainland China and global megacities around the world, highlighting correlations between control measures on human activities and changes in nightlight intensity (Liu et al., 2020; Xu et al., 2021; Yin et al., 2021). Another study focuses on North Korea in particular, determining the impact of international sanctions on the spatial distribution of economic activity within the DPRK from 1992 to 2013 using Defense Meteorological Satellite Program (DMSP) satellite data (Lee, 2018).
This research begins by following the precedent set by Dasgupta to use nightlight satellite data to determine the economic impact of the COVID-19 pandemic throughout North Korea. It then differentiates itself from Dasgupta in being the first of its kind to compare the effects of COVID-19 at a regional level using a geospatial panel regression analysis with fixed effects to determine changes in nightlight intensity as distance from the capital city, Pyongyang, increases. Following this, it compares the nine provinces in North Korea, including Chagang, Kangwon, North Hamgyong, North Hwanghae, North Pyongan, Ryanggang, South Hamgyong, South Hwanghae, and South Pyongan, as well as the separately administered capital of Pyongyang, Kaesong industrial region, Sinuiju special administrative zone, and Rason SEZ, to determine if there were particular region and district-level patterns in the reallocation of economic activity during the COVID-19 pandemic through a variety of binary indicators including border districts; agriculture, mining, and manufacturing focused districts; and districts containing known chemical weapons facilities, nuclear weapons facilities, and missile launch sites.
As of the writing of this analysis, there is no currently published research that analyzes the economic impact of the COVID-19 pandemic in North Korea using nightlight data, making this article the first to do so (Kim, 2022; Lee, 2024). Along with this, no currently published studies to date have performed geospatial panel regression analysis with fixed effects using nightlight intensity data to determine the effects of distance from Pyongyang on nightlight intensity in the DPRK. Furthermore, this study is the first of its kind to use VIIRS satellite data – with much better low-light detection capabilities (Defense Meteorological Satellite Program (DMSP) data tends to miss rural, low-density areas), higher geospatial accuracy, and more recently available data (DMSP ended in 2013) – to determine regional differences in nightlight intensity in the DPRK (Gibson, 2020).
Methodology
Sensitivity analysis was performed to determine which time periods would account for a minimally biased and representative comparison of nightlight intensity in the DPRK before and in the midst of the COVID-19 pandemic. While COVID-19 officially became a global pandemic in March 2020, North Korea announced harsh quarantine measures at the end of January 2020, and started severely restricting border regions in February 2020 (Human Rights Watch, 2022). Therefore, January 2020 was chosen as the base period for analysis as this month represents the most recent month of North Korea’s pre-pandemic economy. While the first COVID-19 vaccines were created in the final months of 2020, with the first mass vaccination rollouts occurring months afterwards, North Korea would not begin its first COVID-19 vaccination campaign until September 2022, due in part to vaccine shortages and a rejection of previous offers to receive AstraZeneca and Sinovac vaccines – only the countries North Korea and Eritrea at the time had not previously started vaccinating its citizens (Yoon, 2022). As vaccination of individuals within a country leads to the reduced likelihood of disease contraction and the subsequent loosening of national economic restrictions, the extremely late rollout of the COVID-19 vaccination in North Korea implies that lockdowns and other preventative measures – measures that have proved to stifle economic activity – were likely in place in North Korea until at least September 2022. Therefore, time periods after September 2022 were not considered for the central analysis of this article, which aims to look solely at the changes in economic activity vis-à-vis nightlight intensity data for North Korea in the midst of the pandemic (pre-vaccination rollout, and more likely the height of the negative economic shock).
During North Korea’s last major negative economic shock, the Great North Korean Famine, the triaging by the DPRK to reallocate food rations and other resources took over a year to be fully realized, making it reasonable to assume it could take more than a year for economic realignment policies in North Korea to be fully implemented (Natsios, 2002). This is supplemented by increasing trends in global, as well as regional, COVID-19 case rates and mortality rates through 2022 (Kim & Yeniova, 2022). Ultimately, January 2022 was chosen at the final post period month to provide an ample analysis period, while also accounting for differences in nightlight usage by season. While the two-year comparison period could have started and ended on a different month than January (for instance, November 2019 to November 2021), this analysis started with January 2020 as the base period month and therefore ended with January 2022 to provide the most accurate assessment of North Korea in the midst of the pandemic. As the seasonal pattern of nightlight intensity in North Korea (and other countries) should generally be constant apart from random fluctuations, monthly time controls should sufficiently address seasonality and were included in the regressions used in subsequent analysis.
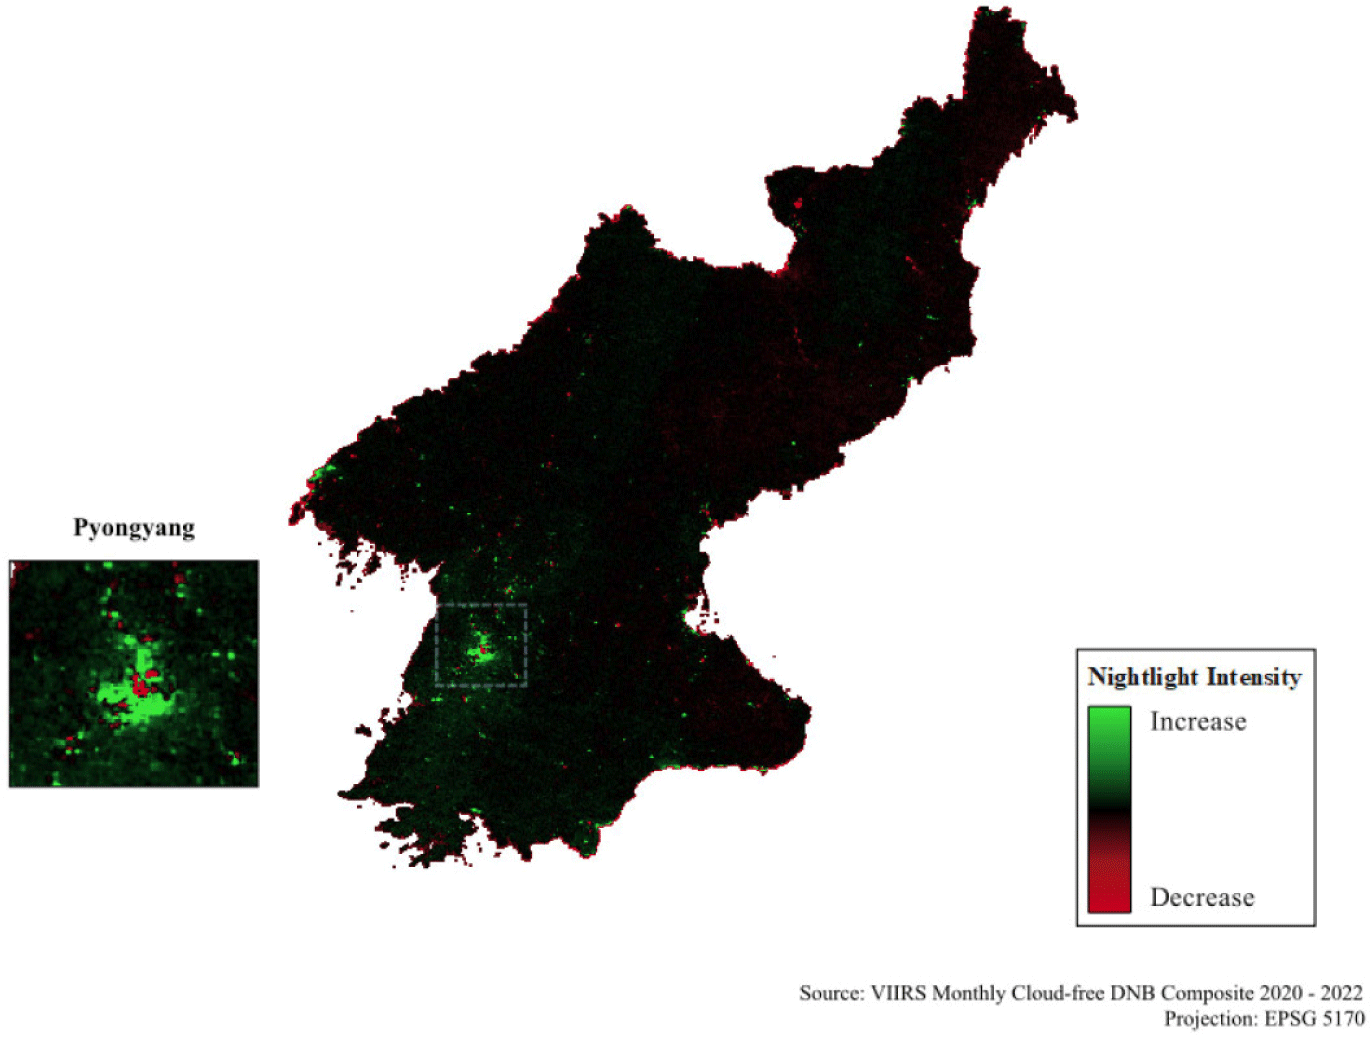
While currently the COVID-19 virus still remains a threat to the health and well-being of much of the world’s population, case rates have dropped precipitously worldwide since the first years of the pandemic, leading many officials to designate 2023 as the end of the disruptive phase of the pandemic (Castillo, 2023). To supplement this, in May 2023, WHO announced the suspension of COVID-19 as a public health emergency of international concern, officially moving the world into the post-pandemic era (World Health Organization, 2023). While this article is intended to look specifically at the effects of COVID-19 as a negative economic shock in the DPRK, along with its impact on North Korean society and human rights, to provide a basis for the future effects of global catastrophes and negative economic shocks on North Korean society, an additional, brief, comparison of nightlight intensity from January 2022 to January 2023, along with a discussion of how trends in nightlight intensity may have changed during this period, is also included in the Appendix 1 to supplement this article’s findings.
After a sensitivity analysis was performed to determine the base and final monthly time periods for comparison, world nightlight raster data from VIIRS cloud-free Day/Night Band (DNB) composites for every month between January 2020 and January 2022 was imported into QGIS version 3.28.15 and clipped to the extent of North Korea. It is important to note that May, June, and July of 2020 and 2021 had no VIIRS satellite data available for North Korea (due to data distortion from solar illumination that occurs towards the poles during their respective summer months), reducing the number of months from 25 to 19 in this analysis (Earth Observation Group, 2024). Each raster was reprojected into ESPG 5170, a projection made specifically for the Korean Peninsula that preserves distance and uses meters. Although this analysis used monthly VIIRS DNB composites, which reduce cloud cover variability to better compare time periods, there were differences in observed radiance in the composites (often caused by the emission of light in the high atmosphere, a phenomenon called airglow), which is known to change even on short times scales in composites (Shepherd & Cho, 2017). These differences in observed radiance, for instance, make the January 2022 composite image appear brighter than the January 2020 composite image across all pixels, which would skew the geospatial analysis if not properly addressed.
To address this issue, the average difference in lighting between areas with varying levels of observed radiance was calculated for each month compared to the January 2020 monthly composite, using an area of interest with no visible nightlight activity in the Sea of Japan (a circle with a radius of approximately 10km centered at the location 39.6842°N, 128.8774°E) as the basis for the comparison. To perform this calculation, a raster was created at this area of interest with the mean nightlight intensity values across all pixels for each of the monthly composites. Each of these created area of interest rasters was then individually subtracted from the January 2020 area of interest raster and mean difference values were calculated; these value were subtracted from all pixel values within each respective monthly nightlight composite raster to obtain a more accurate monthly average nightlight intensity change in North Korea in the period before and during the COVID-19 pandemic (see Appendix Table A1 in the Appendix 1 for difference values for each monthly composite). Following this, the results of the differences in nightlight intensity from January 2020 to January 2022 were mapped in QGIS using a gradient of green for increases in intensity and a gradient of red for decreases in intensity, with deeper hues representing greater magnitudes of change (black signified no changes in nightlight intensity).
Distance analysis was performed to determine the spatial effects of differences in nightlight intensity as the distance from Pyongyang increases. Pyongyang was marked on the map using the QGIS plugin Lat Lon Tools at the location 39.0392°N, 125.7625°E, and from this location the mean spatial distance from Pyongyang was calculated in kilometers for each administrative district in North Korea using the Database of Global Administrative Areas (GADM) Admin-2 level administrative areas (186 districts total, grouped into 13 provinces/special administrative regions). The average change in nightlight intensity for each district was calculated, natural log transformations on the average change in nightlight intensity and the distance from Pyongyang were performed (as nightlight intensity values before transformation had no meaningful interpretation, taking the natural log allows for the approximate percent change in nightlight intensity to be interpreted, along with distance), and these results were analyzed together in RStudio 2021.09.0 using a two-way fixed effects panel regression. The final panel regression model used in this analysis to examine average nightlight intensity by district as distance from Pyongyang increases is:
where yit is the mean nightlight intensity (natural log); Xit is the mean distance from Pyongyang (natural log); Zi is the province-level population density; μi is the control for time invariant district-specific factors; δt is the monthly fixed effects control; β0, β1, β2, and β3 are coefficients; i is the indice for units (in this case, each district in North Korea); t is the indice for time (in this case, month); εit and is the error term (which is assumed to vary non-stochastically over i and t in the fixed effects models, and vary stochastically over i and t in the random effects model). The most recent population census in North Korea was performed in 2008, and the official population numbers from this census report were used to perform population density calculations by region, which were subsequently used as a control in this regression analysis (Kim, 2009). Due to the extended period of time since the last census, these population density estimates have likely changed slightly, but were still included to provide insights in the regression models. Other regional controls, such as Gini coefficient by region, are not available for the DPRK, and were therefore not included in the regression model and inherently limited the power of this analysis.
For the analysis of interregional differences in nightlight intensity in the DPRK during the COVID-19 pandemic, districts bordering China and districts bordering South Korea (ROK) were coded using geospatial district-level data from QGIS. Following this, agricultural provinces (North Hwanghae, North Pyongan, Ryanggang, and South Hwanghae) were derived based on the top third agricultural self-sufficiency rankings from FAO organizational data (Smith, 2009). Mining provinces (North Hamgyong, North Hwanghae, North Pyongan, South Hamgyong, and South Pyongan), which had above the average provincial distribution in the number of active mines (8.3%), were derived from South Korean economic statistics on North Korea (Kim, 2016). Manufacturing provinces (Chagang, Pyongyang, North Hamgyong, South Hamgyong, and South Pyongan) were derived from official South Korean government statistics by determining which provinces had above the average percentage of its working population engaged in the manufacturing sector, versus agriculture or service sectors (i.e., above 33%); special economic/industrial regions (Sinuiju, Rason, and Kaesong) were also positively coded (Korean Institute for National Unification, 2019).
Known administrative districts within provinces that focused on chemical weapon production and development were derived from reports from the Center for Strategic and International Studies (Cordesman et al., 2016). Other known districts that focused on nuclear development, along with districts with known missile launch sites, were coded using previously published satellite data analysis (Nikkei Asia, 2018). These binary dependent variables were tested against monthly average nightlight intensity measures from January 2020 to January 2022 using panel regression models with two-way fixed effects to determine regional and district-level differences in nightlight intensity changes due to the COVID-19 pandemic. The final panel regression model used in this analysis to examine average nightlight intensity by district with the binary variables of interest is:
where yit is the mean nightlight intensity (natural log); Xit is the binary variable of interest (1 or 0); Zi is the province-level population density; μi is the control for time invariant district-specific factors; δt is the monthly fixed effects control; β0, β1, β2, and β3 are coefficients; i is the indice for units (in this case, each district in North Korea); t is the indice for time (in this case, month); εit and is the error term (which is assumed to vary non-stochastically over i and t in the fixed effects models, i and t vary stochastically over i and t in the random effects model).
As the data varies across spatial units and time, a fixed or random effects panel analysis would likely be better suited to fit this data over an OLS regression analysis. To statistically confirm this, an F test for individual effects was conducted, with the null hypothesis indicating that there is no significant difference in using an OLS model versus a fixed effects model. The resulting p-value of the F test was <0.001, which rejects the null hypothesis and indicates that a panel data analysis is better suited to this data (this analysis assumes statistical significance comes at p-values of 0.05 or less).
To determine whether a fixed effects or a random effects regression would better suit the panel data in this analysis, a Hausman test was performed, which compares fixed effects and random effects estimates, with the null hypothesis being that both random and fixed effects are consistent (and thus, the random effects mode is preferred due to its higher efficiency). The Hausman test gave a p-value of 0.0017, meaning that the null hypothesis can be rejected and a fixed effects model may be better suited for this analysis. However, studies have shown that the Hausman test tends to have considerably low power and could over-reject the null hypothesis, which should be taken into consideration when interpreting the results (Sheytanova, 2015). Due to this, a random effects model is also included in the results for reference.
To determine if spatial autocorrelation exists in the dataset, a Global Moran’s test was performed, which gives a correlation score between 1 and –1 (with 1 meaning perfect positive spatial autocorrelation (i.e., the data is spatially clustered), 0 meaning random distribution of data points, and -1 meaning dissimilar values are next to each other). The correlation score was found to be 0.5045 with a p-value<0.001, meaning that there is likely spatial clustering of nightlight intensity in the data. To help account for this, the analysis included regional-level clustering in its two-way fixed effects and random effects models.
Results
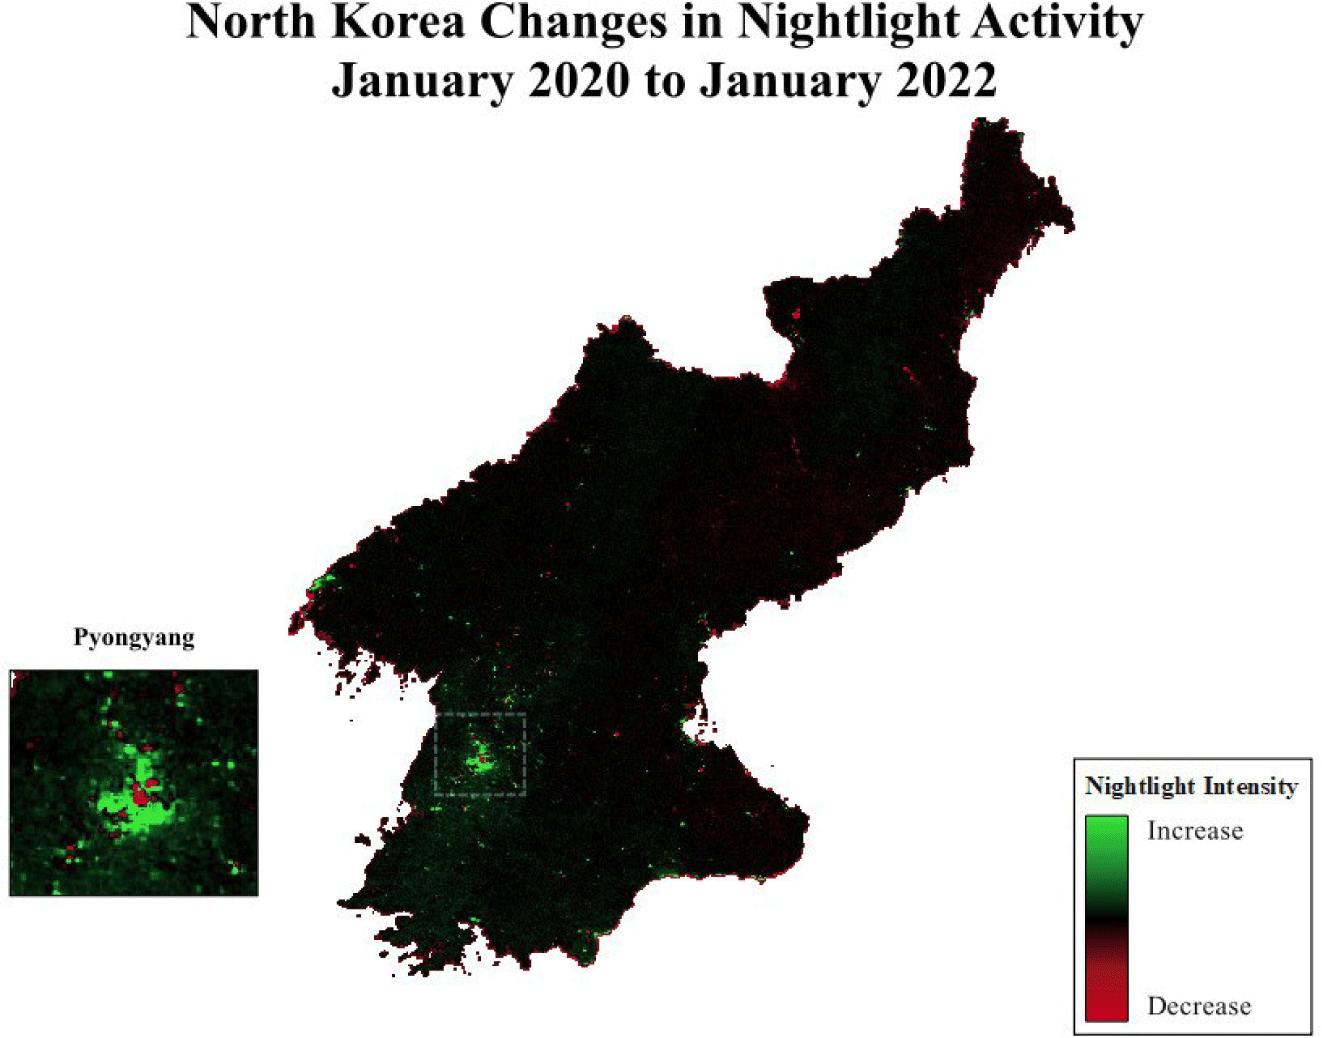
Fig. 1 shows increases in nightlight intensity during the analysis period in Pyongyang, North Korea’s capital, as well as areas near Pyongyang, indicating that economic activity may have been redistributed towards the capital after the onset of the COVID-19 pandemic. The north and northeastern regions of the country show slight decreases in nightlight intensity during the analysis period, indicating that these regions could have experienced reduced economic activity as a result of the pandemic. Generally, slight increases in nightlight intensity during the analysis period are seen in the western and southern regions of the country, along with Sinuiju, in the northwestern tip of North Korea. These results are corroborated by Fig. 2, which shows very slight increases in nightlight intensity over time for Pyongyang and Sinuiju, with other regions having less visually discernable differences over time. Surprisingly, a majority of regions experienced a dip in nightlight intensity in September 2021, which potentially indicate a critical energy shortage in much of North Korea for a portion of this month. Large, rolling blackouts in northeastern China along the North Korean border in September 2021 may have spilled over and affected regions in North Korea, as these blackouts were caused by a massive shortage of coal in China (Park, 2021). Reports have confirmed that North Korea illicitly provided coal to China during this period despite Chinese sanctions on North Korean coal imports in 2017, which likely came at the expense of North Korea’s own energy supply (Frohman et al., 2022).
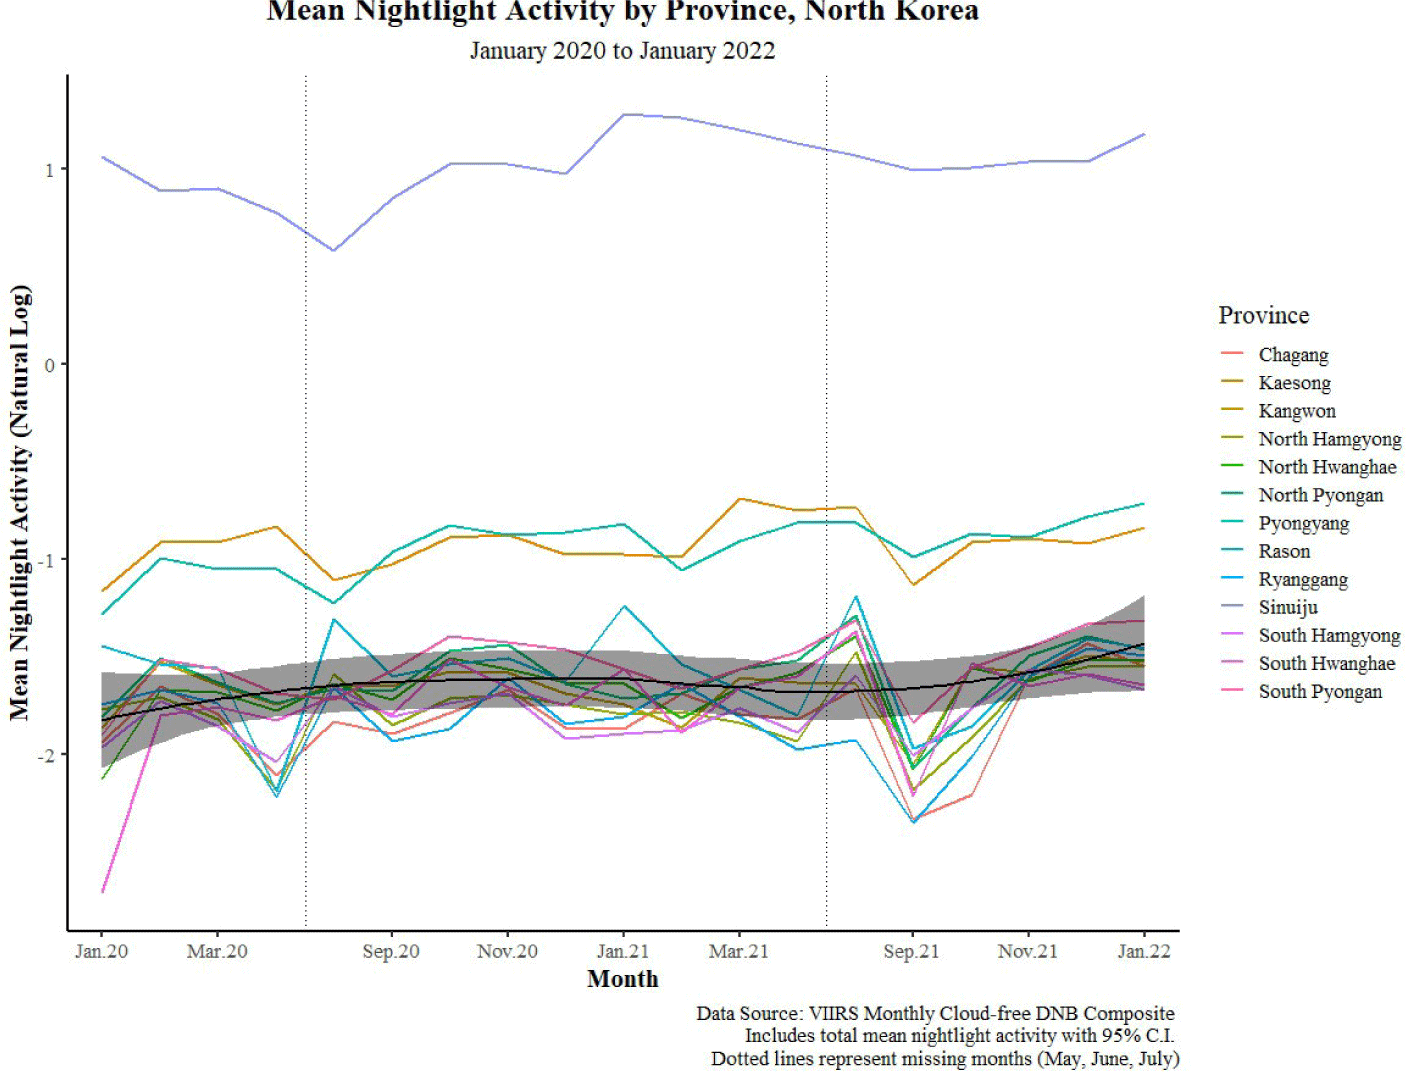
Total number of provinces (including special administrative regions): 13. Total number of districts: 186. Population data was taken from the most recent census data available from North Korea (2008). 4,650 total observations; observations were reduced to 3,534 due to missing satellite data for May 2020, June 2020, July 2020, May 2021, June 2021, and July 2021.
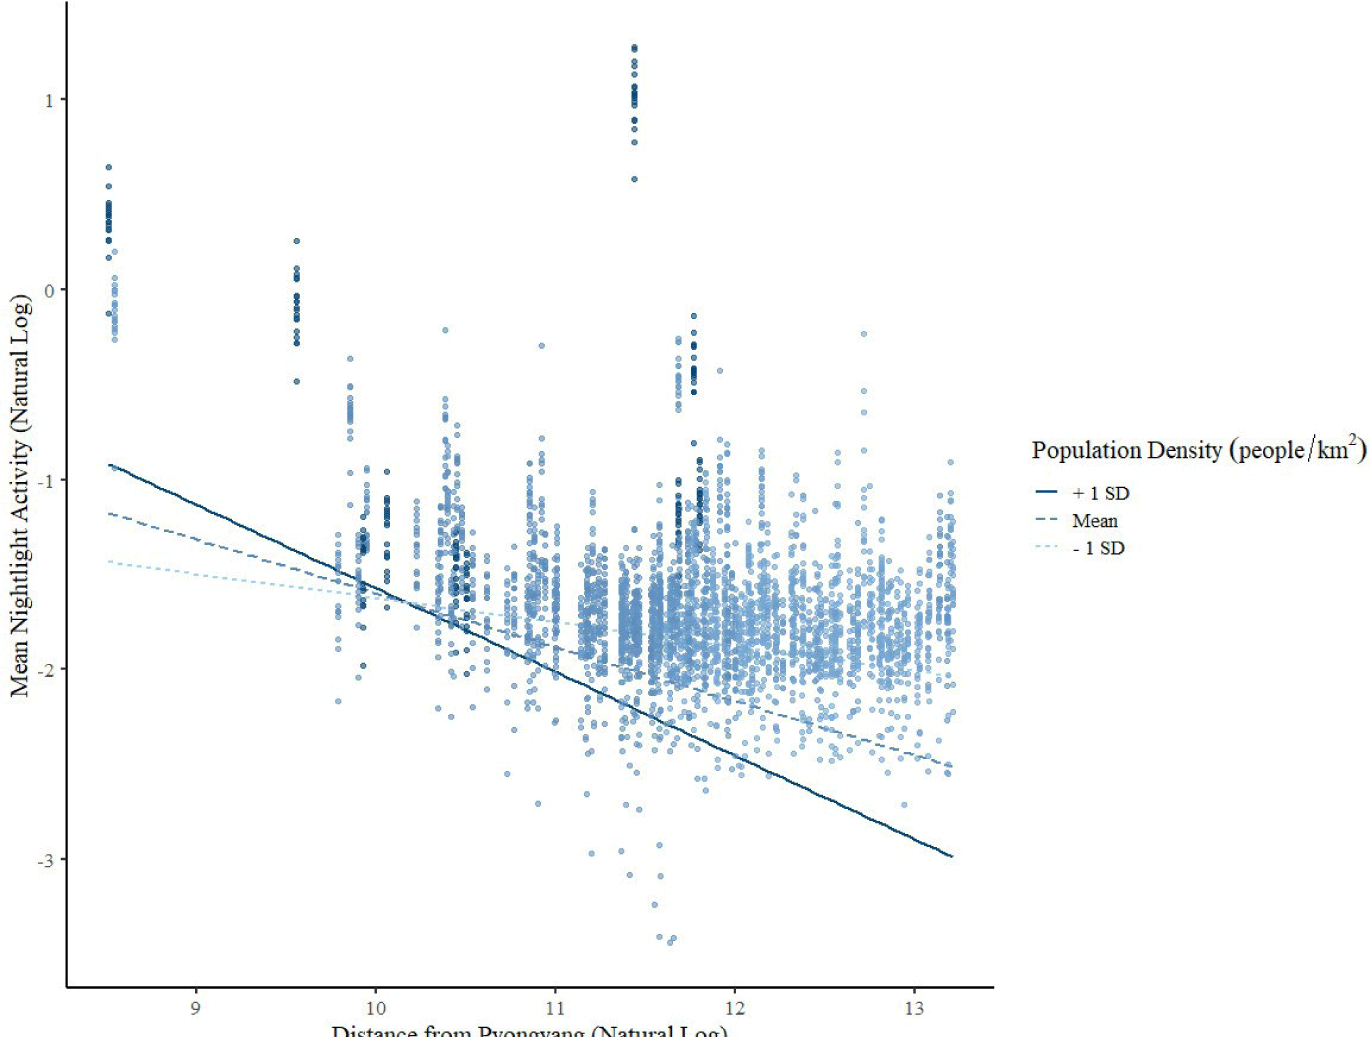
In Fig. 3, there are initially positive changes in nightlight intensity from January 2020 to January 2022 near Pyongyang, which trends downward to negative changes in nightlight intensity as the distance of districts from Pyongyang increases. This is corroborated by the panel regressions in Table 2, which show across all models statistically significant decreases in nightlight intensity as distance from Pyongyang increases. The most accurate model for this analysis, determined earlier in this article, is the two-way fixed effects panel model with regional clustering (see Model 5 in bold in Table 2); the adjusted R2 value for this model is 0.6041, meaning that approximately 60% of the variation in nightlight intensity can be explained by the independent variables in this model (this is generally considered an acceptable goodness-of-fit). Using this model, a one percentage point increase in the distance of districts from Pyongyang is associated with a decrease in district nightlight intensity by 0.21 percentage points (p<0.001) from January 2020 to January 2022. Furthermore, an increase in one person per km2 in population density is associated with a 0.02 percentage point increase in average nightlight intensity during the analysis period (p<0.001), along with a slight but statistically significant (p<0.001) negative interaction between provincial population density and distance from Pyongyang (see Appendix Fig. A1 in the Appendix for a visual representation of this interaction).
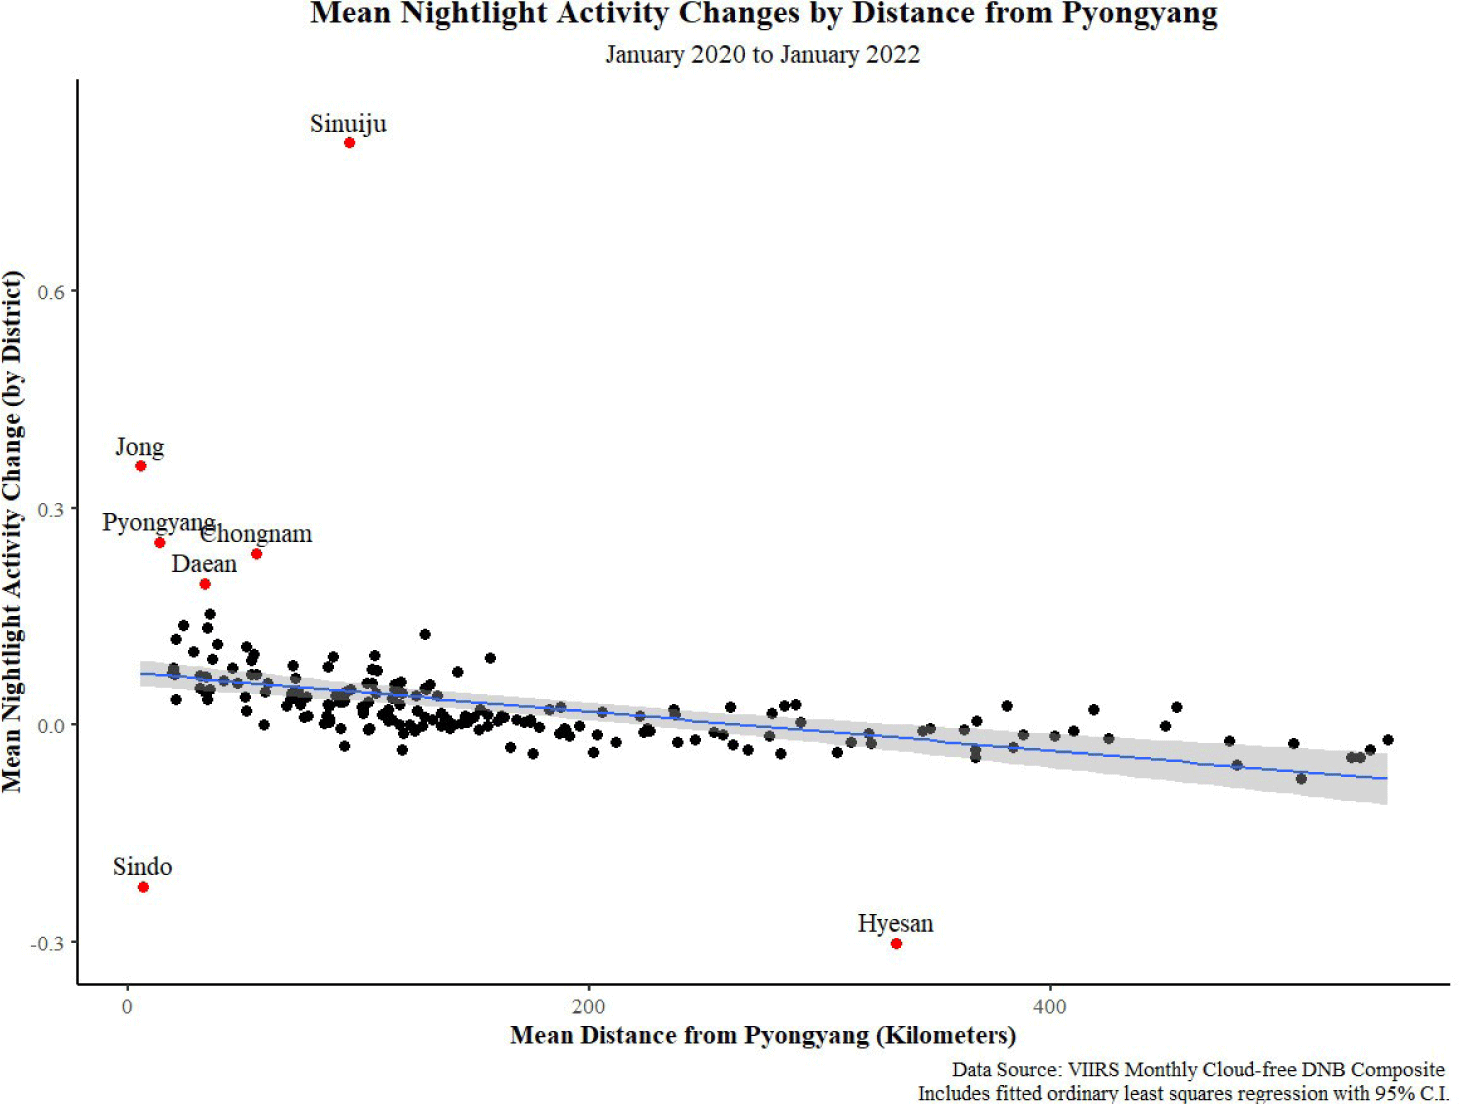
As a note, outliers were designated in Fig. 3 as districts that are either less than the first quartile (Q1) of the data minus two times the interquartile range (IQR), or greater than the third quartile (Q3) of the data plus two times the IQR. A general rule to find outlier points is to use Q1 – 1.5 × IQR and Q3 + 1.5 × IQR; this analysis uses 2 × IQR to remain conservative in its outlier estimates.
In Table 3, the results show that being a district that borders South Korea (Model 2) was associated with a 29.79 percentage point increase in nightlight intensity from January 2020 to January 2022 compared to non-border districts (p<0.001); being a district focused on mining (Model 4) was associated with a 4.27 percentage point increase in nightlight intensity in the same period compared to non-mining districts (p<0.01); districts with known chemical facilities (Model 6) and nuclear facilities (Model 7), compared to districts without these facilities, were associated with 22.72 percentage point and 24.66 percentage point increases in nightlight intensity from January 2020 to January 2022, respectively (p<0.001); being a district with a known missile launch site (Model 8), compared to districts without a missile launch site, was associated with a 14.20 percentage point decrease in nightlight intensity in the given time period (p<0.001). Districts bordering China (Model 1), along with districts focused on agriculture (Model 3) and manufacturing (Model 5), did not show any statistically significant changes in nightlight intensity from January 2020 to January 2022 compared to districts not bordering China, districts not focused on agriculture, and districts not focused on manufacturing, respectively.
However, the results of the first experiment in this analysis found strong positive changes in nightlight intensity in Sinuiju, a special administrative region that focuses intensively on manufacturing and is also a border region with China. This analysis checked to see if the major SEZs of Sinuiju, Rason, and Kaesong had positive increases in nightlight intensity compared to other districts during the analysis period, with the results shown in Table 4.
The results of Table 4 show that the SEZ of Sinuiju (Model 9) and Kaesong (Model 11) showed a strong, statistically significant positive increase in nightlight intensity (of 263.20 percentage points and 72.20 percentage points) during the analysis period compared to regions outside of Sinuiju and Kaesong, respectively (p<0.001). A positive increase of 11.17 percentage points was found for Rason (Model 10), which has a significance level of p<0.10 that is close to, but not considered significant in this analysis. Based on these results, major SEZs were excluded from the manufacturing focused and border with China models to ensure these results in particular were not skewed by the SEZs, and the results are presented in Table 5.
The updated results remained insignificant for districts that border China (Model 12). However, districts (excluding the major SEZs) that focused on manufacturing (Model 13) saw a 2.1 percentage point decrease in nightlight intensity during the analysis period compared to districts not focused on manufacturing (p<0.05). The adjusted R2 values for most of the models in this experiment are between 0.29 and 0.41, which means that approximately 29% to 41% of the variation in nightlight intensity can be explained by the binary variable of interest in each respective model. Compared to the models in the first experiment, the R2 values for the models in the second experiment are slightly lower, indicating a weaker fit that should be taken into consideration when interpreting these results.
Discussion
The results of this analysis showed that nightlight intensity in North Korea has not decreased throughout the country as a whole, since Pyongyang and a select few other districts’ nightlight intensity has increased from January 2020 to January 2022. This opposes this article’s original hypothesis that nightlight intensity would decrease throughout the entire country due to the negative economic shock of COVID-19. However, the results of the first experiment showed that the DPRK appears to have redistributed economic activity towards the capital and higher population density areas after the onset of the pandemic, while moving economic activity away from regions farther from the capital (particularly in the north and northeastern regions). This is shown by results highlighting increases in nightlight intensity in Pyongyang and nearby outlier districts, along with a statistically significant negative trend in the change in nightlight intensity as distance from Pyongyang increases during the analysis period. This supports this article’s second hypothesis that the DPRK may have tried to preserve economic activity for those in higher songbun classes who are predominantly located in the capital and preserve activity for urban, higher population density areas, which were found to be less prevalent as distance from Pyongyang increases (as shown by the interaction term in Fig. 3, Model 5), versus those in lower songbun classes farther from the capital and in rural, lower population density areas during the pandemic.
The results of the second experiment showed that districts bordering the ROK had increases in nightlight intensity compared to districts that did not border South Korea. These changes may be explained by the DPRK’s tightening of border controls during the pandemic, which would increase the need for patrols and border infrastructure on the South Korean border. This explanation is supported by statistics showing a marked decrease in North Koreans escaping North Korea from either border since the onset of the pandemic: only 67 North Korean defectors escaped and successfully made it to South Korea in 2022, compared to 1047 North Korean defectors in 2019 (Bremer, 2023). Along with this, there is a possibility that the DPRK wanted to maintain the image of a strong country unaffected by the pandemic to South Korea, a central rival, and therefore bolstered activity (particularly military drills) along the South Korean border; a political maneuver that the DPRK has made many times historically, and often in tit-for-tat with South Korea (Kim, 2024).
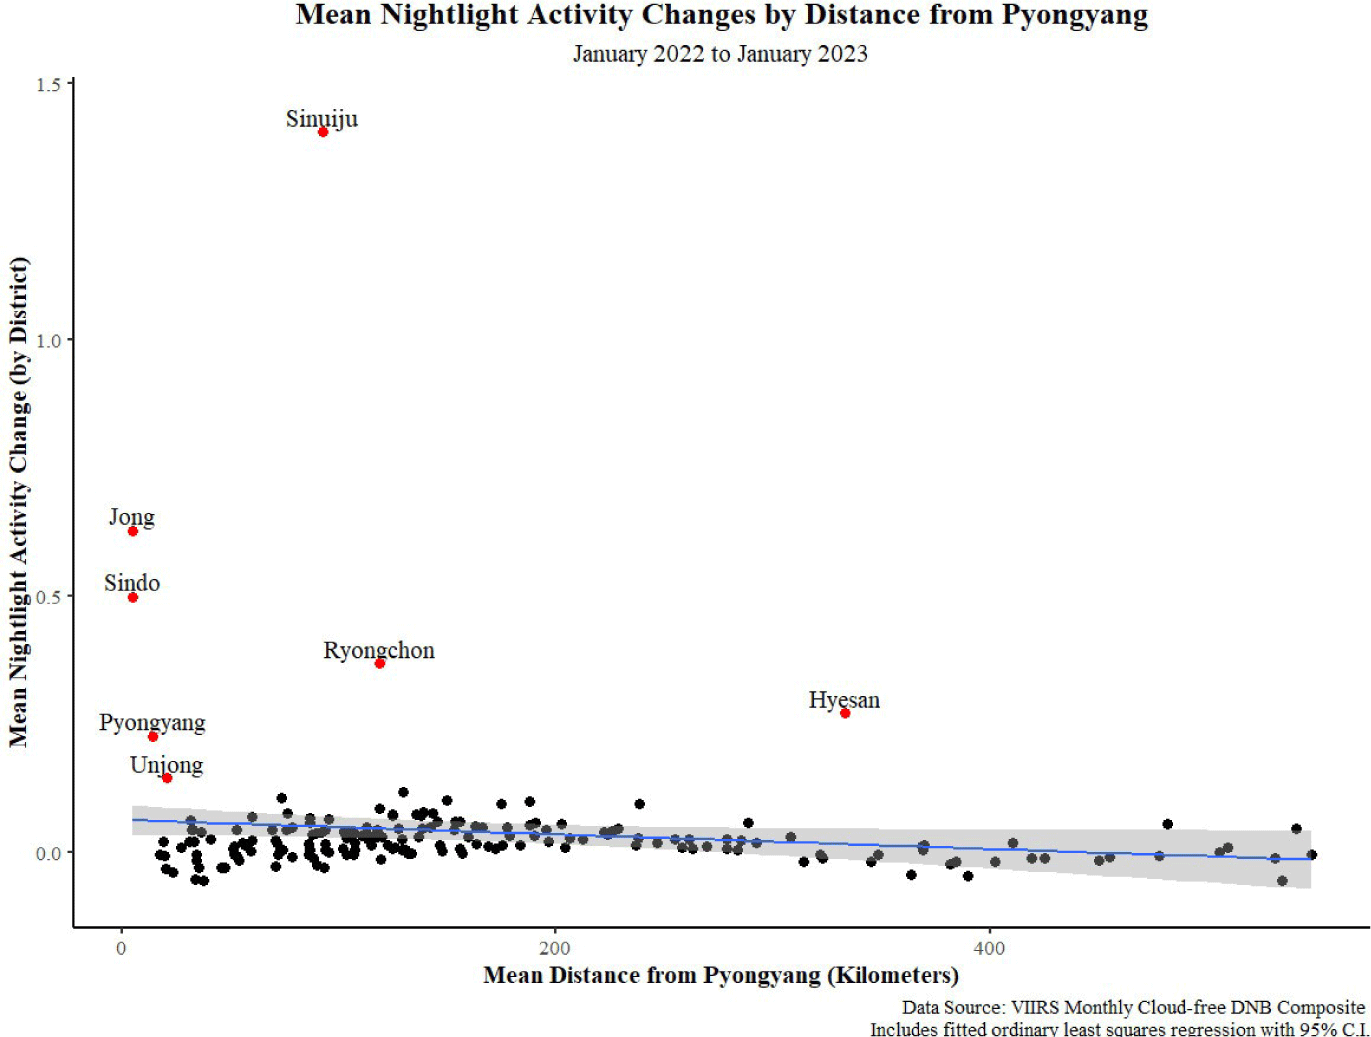
However, there were no significant changes in nightlight intensity during the analysis period for districts that border China versus those that do not, contrary to this article’s third hypothesis. It is possible, then, that the increases in economic activity (and therefore nightlight intensity) from increases in border patrols and infrastructure on the Chinese border were offset by the halting of trade in China in the midst of the pandemic, which is corroborated by data showing a reduction of Chinese exports to North Korea by 81% and a reduction of North Korean exports to China by 78% in 2020, with further declines in 2021 (Stangarone, 2021). One exception would be Sinuiju, which is a border district with China that saw increases in nightlight intensity from January 2020 to January 2022; its status as a SEZ and the regime’s repeated attempts to attract foreign investment here may have shielded it from the effects of reduced trade with China. Rason and Kaesong, other SEZ in North Korea, share similar marked increases in nightlight intensity during the analysis period, although not to the magnitude (or in Rason’s case, to the level of statistical significance) of Sinuiju.
Two other Chinese border districts – Sindo and Hyesan – experienced significant negative changes in nightlight intensity from 2020 to 2022. Hyesan, a northern city, is known for river transportation and product distribution, which were almost certainly stifled when trade with China ceased during the pandemic, possibly reducing economic activity in the district (Choi, 2011). Sindo, a county known for its fishing industry, is located primarily west of the Yalu river and directly connected to contiguous Chinese land, may have had outsized negative economic effects stemming from the reduction of trade with China during the pandemic (Winstanley-Chesters, 2020).
The results of the second experiment also showed that districts focused on mining had increases in nightlight intensity compared to districts that did not focus on mining, and districts focused on manufacturing (SEZs excluded) had decreases in nightlight intensity compared to districts not focused on manufacturing from January 2020 to January 2022, while districts that focused on agriculture did not have statistically significant changes in nightlight intensity compared to districts that did not focus on agriculture during this period. While increases in nightlight intensity for districts focusing on mining compared to non-mining districts and decreases in nightlight intensity for districts that focus on manufacturing compared to non-manufacturing districts support this article’s fourth hypothesis, the other findings oppose this hypothesis, which assumed that agricultural districts would have increases in nightlight intensity in the analysis period compared to non-agricultural districts (they did not).
Along with this, and perhaps most importantly, districts that had known chemical and nuclear facilities experienced significant increases in nightlight intensity between January 2020 and January 2022 compared to districts without these facilities, while at the same time, districts with known missile launch sites experienced significant decreases in nightlight intensity during the analysis period compared to districts without launch sites. This also goes against this article’s fourth hypothesis, which assumes that the Kim regime would have moved resources away from chemical and nuclear weapons development during the COVID-19 pandemic.
An interesting narrative appears when examining these results. Although North Korea officially resumed its nuclear weapons program in May 2022, these results suggest otherwise (Smith, 2022). They indicate that while North Korea may have reduced its missile launches during the COVID-19 pandemic (this is corroborated by data from the Missile Defense Project, which shows a substantial decrease in missile launches in 2020 and 2021), it may have continued to focus heavily on nuclear and chemical weapons development, along with mining (possibly for the gathering raw materials needed for its nuclear and chemical weapons development). This is likely at the cost of the regime moving its priority away from the more essential needs of its citizens (i.e., food production and procurement).
Missing VIIRS monthly composite nightlight data from the months of May 2020, June 2020, July 2020, May 2021, June 2021, and July 2021 reduced the number of months used in this analysis from 25 to 19, which could have impacted this analysis, especially if unique yearly changes in nightlight intensity occurred during these months. While this article assumed based on the literature that low to no levels of light were indicative of little to no economic activity, it is not always necessarily the case that areas with little to no nightlight intensity do not have economic activity present (for instance, it is possible that in some districts, an influx of workers arrive during the day to work, and leave that district by nightfall). However, due to the DPRK’s law forbidding movement between districts without explicit permission, this makes this possibility less likely (although certainly not impossible).
As well as this, the majority of regions experienced a dip in nightlight intensity in September 2021, which may have stemmed from North Korea illicitly providing coal to China during this period at the expense of North Korea’s own energy supply. While the shortages of coal in China were a result of the COVID-19 pandemic, the effect that this had on North Korea’s nightlight intensity measures in September 2021 (and potentially the months after) were not caused directly by the pandemic per se (rather, it was caused by the DPRK’s decision to send coal to China). Therefore, this could have caused bias in this analysis.
Within geospatial analyses using nightlight satellite data, nightlight spillover can occur near border regions. In this analysis, it cannot be ruled out that some nightlight intensity spillover occurred in North Korean districts near the Chinese and South Korean borders, which could skew the results to make border districts appear to have higher nightlight intensity levels than the intensity levels that they are actually producing within their borders. Therefore, the results looking at differences in nightlight intensity between border and non-border districts should be taken lightly. Along with this, China has in the past been and currently is the largest trade partner with North Korea, accounting for 96.7% of North Korea’s exports in 2022 (Lee, 2023). Although North Korea halted practically all official trade to China at the onset of the COVID-19 pandemic, informal trade between these countries still existed. Therefore, any changes in China’s trade policy with North Korea between January 2020 and January 2022 would have likely impacted North Korea’s economy, particularly in the capital Pyongyang, production centers, and districts engaged in trade at the Chinese border. Although no publicly accessible protectionist trade policies by China targeting North Korean imports were found during the analysis period, any internal changes in trade policy by the Chinese Communist Party(CCP) involving the DPRK could be an extraneous factor affecting North Korea’s nightlight intensity usage during the analysis period, potentially biasing the results of this article.
It is also important to concede that the variability of yearly weather patterns could have had an impact on the monthly cloud-free DNB composites used in this analysis, which could bias these results. As well as this, events of cultural significance in North Korea that follow the lunar calendar could skew nightlight usage, as these events would occur on different days (or even months) of each Gregorian calendar year, potentially affecting the mean nightlight usage values found in the DNB composites in a way that monthly fixed effects could have difficulties accounting for. Ultimately, additional controls, such as Gini coefficient by region, internal DPRK policy changes that could have affected nightlight intensity (for instance, propaganda-driven construction projects), and the influence of regional microclimates, could not be included in the regression models due to the lack of publicly available data, which limits the statistical strength of the results in both experiments.
Beyond inherent limitations in using nighttime satellite data, systemic characteristics particular to North Korea could limit the results of this analysis. For instance, lighting in North Korea – beyond practical uses – is also installed and used for propaganda purposes, particularly in Pyongyang and near the South Korean border for foreign observers (Talmadge, 2018). Also, the DPRK’s military often operates in underground facilities to avoid detection by international monitoring organizations, and these facilities would create lighting that is not observable using traditional nighttime satellite imagery (Quinones, 1998). Taking these and previously mentioned limitations into consideration, caution should be used when interpreting the results of this analysis.
Conclusion
Altogether, the results of this analysis make clear that the COVID-19 pandemic has had a substantial impact on North Korea’s distribution of economic activity. These results support assumptions that the COVID-19 pandemic has negatively affected North Korea’s economy in areas outside of Pyongyang, along with lower population density areas, which would have had dire consequences on North Koreans in lower songbun classes outside of the capital, along with those living in rural areas and others living farther from the capital who were already lacking essential resources (such as adequate food and required medicines) before the pandemic, but who were almost certainly further constrained on these resources during the pandemic. Even worse, these individuals may have been subjected to increasingly severe human rights violations, such as forced labor, to supplement the increased demand for resources from elites living in Pyongyang after the halting of trade with China during the first years of the pandemic (Stangarone, 2021).
Increases in economic activity as shown through increases in nightlight intensity in border areas, particularly the South Korean border (although the Chinese border is not ruled out) also support the notion that North Korea bolstered its restrictions on movement of North Korean citizens during the pandemic, which is corroborated by data that shows decreased defections by North Koreans in the years following the onset of the pandemic (Bremer, 2023). On top of already harsh restrictions on movement, this makes the difficult task of moving between districts for better economic opportunities, or the nearly impossible task of defecting the country, even more difficult.
Finally, and perhaps most importantly, the results of the comparative district analysis of nightlight intensity in North Korea between January 2020 and January 2022 imply that – rather than redistributing economic resources to districts focused on agriculture and production to support the essential needs of its citizens – the regime prioritized nuclear and chemical weapons development, along with mining (possibly for coal to use for energy, or possibly for raw materials to support the development of these weapons, or perhaps, both). The results of this analysis, when put together, paint a picture that in a dire economic situation, the DPRK will focus its economic resources on Pyongyang, its borders (particularly the South Korean border), and on nuclear and chemical weapons development – not necessarily towards the sectors of the economy that directly support the entirety of its citizens. It cannot be ruled out that when the next negative economic shock arrives in North Korea, the Kim regime will again prioritize the ruling elite and weapons development, while comparatively neglecting those in lower songbun classes farther from Pyongyang, those in rural regions, and the procurement of agricultural goods for its citizens. This should be an extremely serious cause of concern to the international community, as these trends imply that any negative economic shock affecting North Korea in the future – including further rounds of international sanctions – would not only fail to hinder the DPRK’s nuclear development program, but also cause outsized harmful impacts on predominantly lower-class citizens in the country.
This article should be used as a cautionary tale for policymakers looking to impose sanctions or other generalized economic punishments to impact North Korean elites. These results have shown that during a negative economic shock, such as the COVID-19 pandemic, areas away from Pyongyang would be disproportionately impacted, while the capital itself may be insulated from much of the negative shock itself. Therefore, policymakers should be cautious when applying sanctions to the DPRK and must ensure that – if sanctions are imposed – they target elites specifically, rather than inadvertently harming those in lower songbun classes farther from the capital and in rural areas. In an increasingly connected and uncertain world, North Korean human rights activists should aim to convince national governments to prioritize negotiating access for humanitarian aid agencies in North Korea, and facilitating aid distribution to North Korean citizens (if possible, overseeing aid distribution directly to citizens outside of Pyongyang in the most vulnerable regions rather than through the North Korean government as an intermediary) in the case that another negative economic shock emerges in North Korea. This could save countless North Korean lives and prevent massive-scale human suffering.